The digital twin of Pluspetrol
We simulate 10 years of production over a network moving more than 50,000 barrels a day: Barrelytics models 22 interconnected entities, calculating losses, capacity, and overflow in minutes instead of days.
Simulation horizon projected at daily granularity
Barrels of crude balanced across the network each day
Interconnected entities modeled in the network
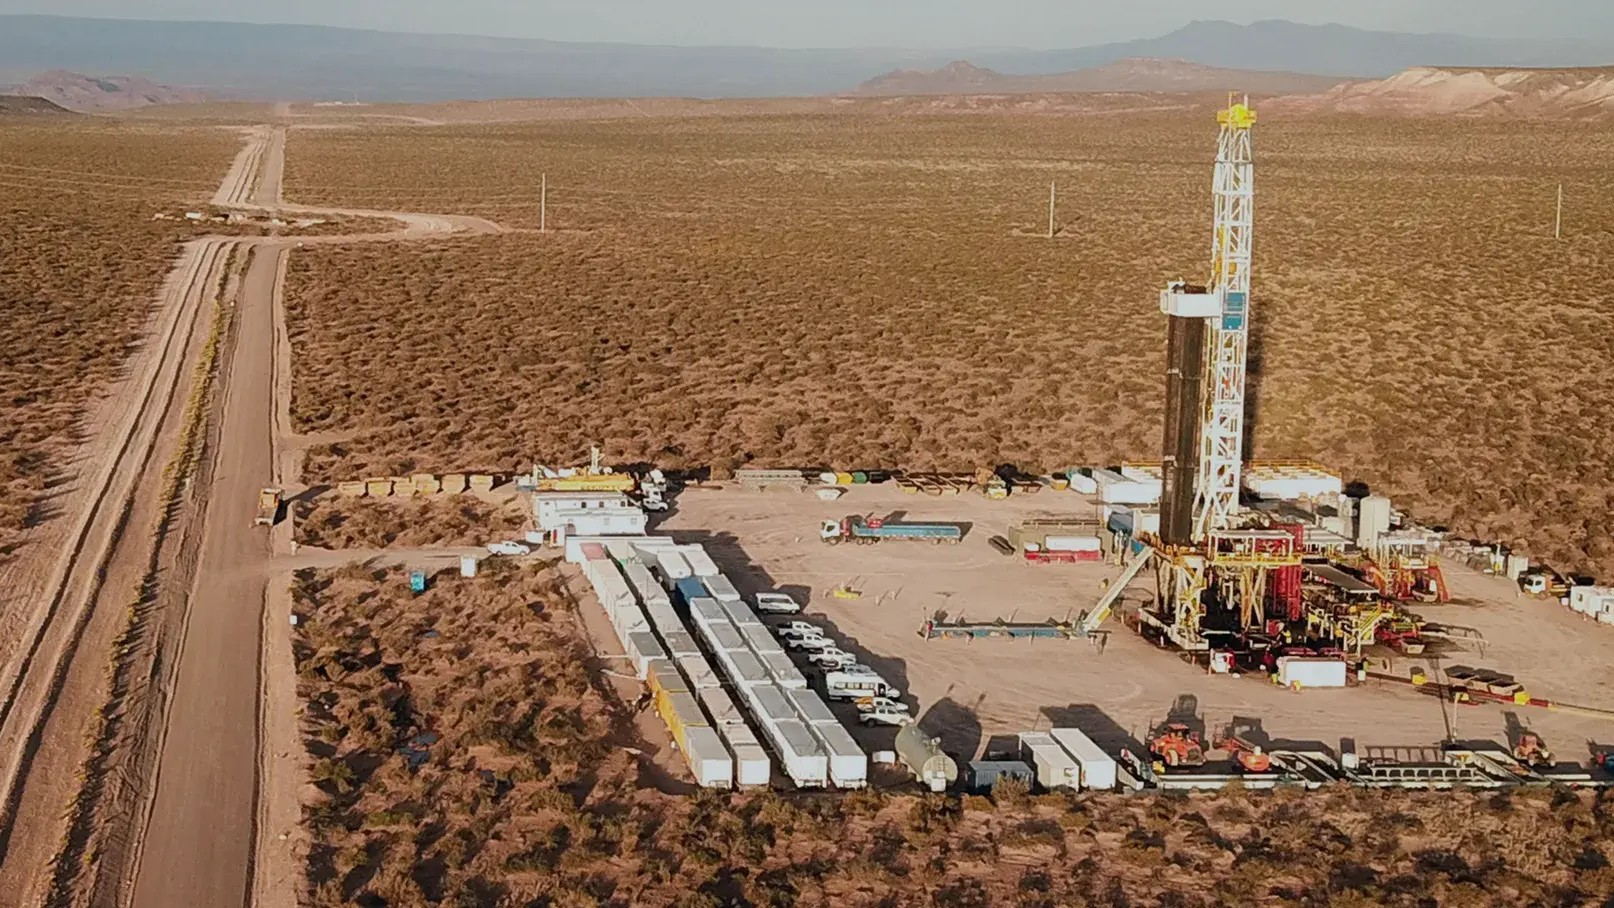
Pluspetrol is one of the largest privately-owned oil & gas exploration and production (upstream) companies in Latin America. With a strategic presence in high-performance basins like Vaca Muerta and Camisea, it runs one of the most complex and demanding bulk supply chains and transport networks in the region.
A fragile spreadsheet held together by manual macros
Before our involvement, operational planning and network modeling for the bulk network depended on a fragile system of interconnected Excel spreadsheets with manual macros.
Slow, cumbersome, and error-prone
Answering a simple question or simulating a scenario change — like a plant shutdown or a production adjustment — meant rebuilding formulas, chasing data across multiple sheets, and redoing calculations manually for hours or days.
Unable to scale
With roughly 52 kbd of crude flowing through a network of 22 interconnected entities — production nodes, intermediate nodes, pipelines, storage, and dispatch points — the spreadsheets collapsed under the sheer number of variables.
Limited visibility into financial impact
In a network that moves hundreds of millions of dollars a year, capturing even 0.1% in efficiency represents millions at stake. Decisions on losses, overflow, and bottlenecks were made reactively, without the speed needed to prevent physical and monetary losses.
Traditional tools fell short
Enterprise suites required 6 to 12 months to implement, forcing Pluspetrol to adapt its operation to rigid models that were already outdated by the time they launched.
An operational digital twin of the entire bulk network
We designed and deployed BARRELYTICS, an operational digital twin that replicates the real topology of Pluspetrol's bulk network and simulates unlimited scenarios in a single click.
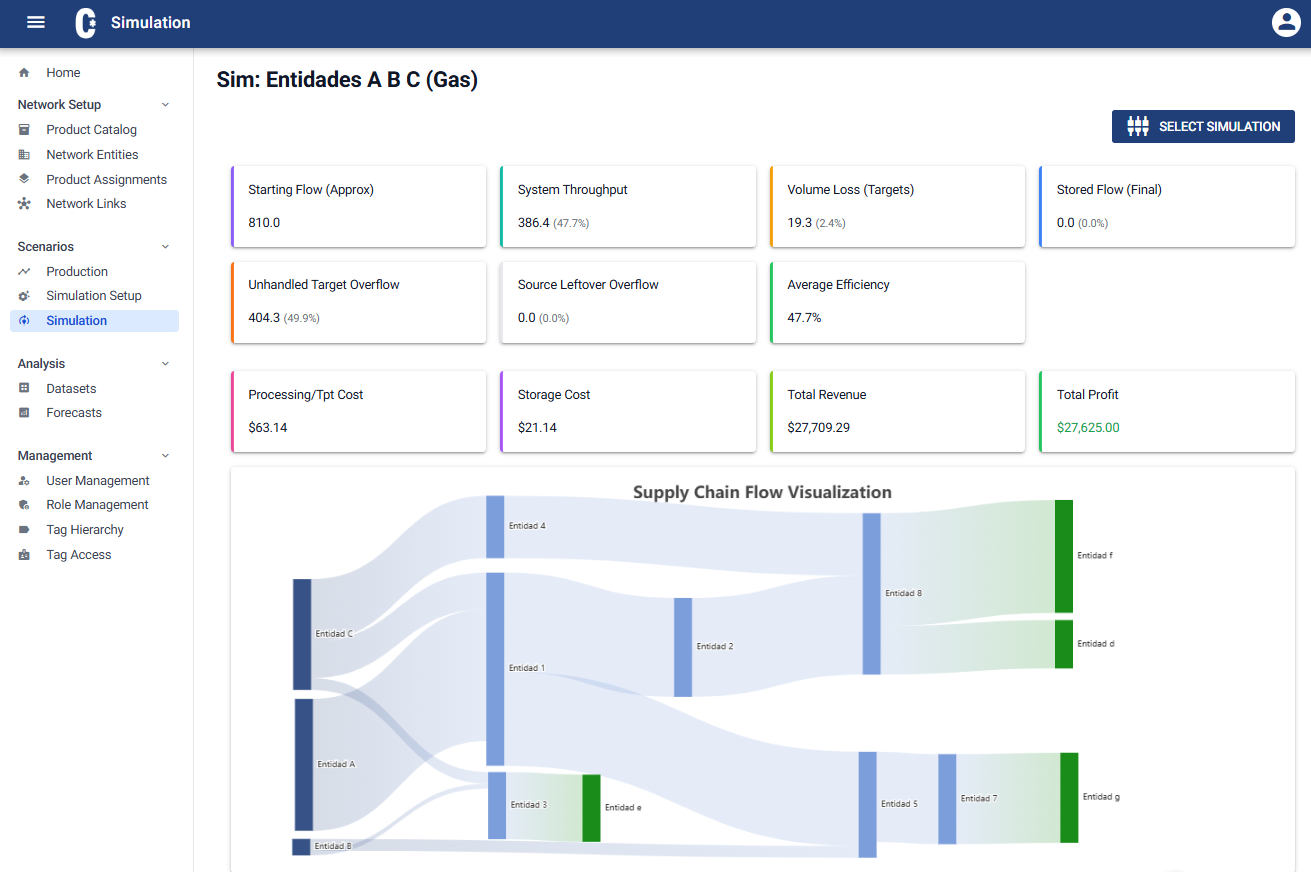
Multi-year simulation engine
Projects the daily crude flow across a 10-year operating horizon (3,650+ simulated days in minutes), calculating throughput, losses, available capacity, and overflow.
Configurable network modeling
Interconnects the 22 operational entities — origins, distribution centers, refineries, truck dispatch, and destinations — with real distribution rules (percentage-based, priority-based, or discretionary).
Direct financial translation
Converts physical metrics (m³ or barrels) into direct economic impact ($/bbl), factoring in process costs, storage, and sale prices.
From kickoff to a live simulation
Kickoff & network load
We loaded the products, the 22 entities, and the real network's connections into the platform.
Live topology
The network topology was modeled with its operating constraints in place.
First simulation
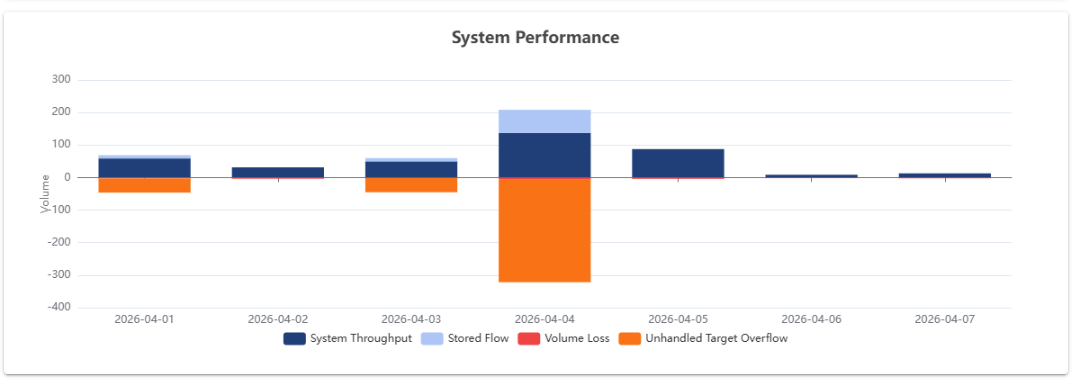
The first 10-year scenario running end-to-end over the real network.
From manual spreadsheets to a one-click simulation
A network that moves hundreds of millions of dollars a year, now modeled, balanced, and simulated with full autonomy, capturing efficiencies that were invisible before.
| KPI | Before (Excel / Macros) | With Barrelytics |
|---|---|---|
| Response time per scenario | Hours or days of manual work | 1 click (5-10 minutes) |
| Daily volume balanced | Static estimates | ~52 kbd of crude audited end-to-end |
| Team autonomy | Heavy reliance on spreadsheets/IT | 100% autonomous to create and modify scenarios |

Want results like this for your operation?
We built the engine that handles losses, capacity, and overflow for one of the most demanding Oil & Gas networks in the region. We can do it for you too.